INTERNATIONAL CAVITATION EROSION TEST
IMP PAN Rep. 20/98 Gdańsk, September 1998
PRELIMINARY
REPORT
PART II :
EXPERIMENTAL DATA
incorporating the update of March 2003
 POLISH ACADEMY OF SCIENCES
INSTITUTE OF FLUID-FLOW MACHINERY
ul.Gen.J.Fiszera
14, 80-952 GDAŃSK, Poland
Phone: +4858
341 12 71; 346 08 81
Fax:
+4858 341 61 44
e-mail: steller@imp.gda.pl
CONTENTS
PART I
CO-ORDINATOR’S REPORT
PREFACE ......................................................................................................................... 3
1.
INTRODUCTION
- ICET BACKGROUND, OBJECTIVES AND PROGRAMME .......................... 5
2.
CONTRIBUTORS AND THEIR TEST FACILITIES ........................................... 13
3.
EXPERIMENTAL DATA ....................................................................................... 17
3.1.
General survey ................................................................................................... 17
3.2.
Data processing technique ................................................................................. 19
3.3.
ICET database software .................................................................................... 21
4.
PRELIMINARY ANALYSIS .................................................................................... 22
4.1.
Vibratory rigs ................................................................................................... 22
4.2.
Rotating disks ................................................................................................... 32
4.3.
Cavitation tunnels ............................................................................................. 38
4.4.
Cavitating jet cells and a liquid jet facility ...................................................... 47
4.5.
Comparative analysis ....................................................................................... 52
4.5.1. Test facilities .......................................................................................... 52
4.5.2. Test materials ............................................................................................. 56
5.
CONCLUSION ......................................................................................................... 65
Nomenclature .................................................................................................................... 67
REFERENCES .................................................................................................................. 69
APPENDIX A
EROSION DATABASE. USER’S GUIDE ................................................................... 71
A.1
General ..................................................................................................................... 71
A.2
Installation .................................................................................................................. 72
A.3
Data access modes ...................................................................................................... 73
A.4
Navigation principles ............................................................................................. 75
A.5
Main objects ............................................................................................................ 78
A.5.1
General ............................................................................................................ 78
A.5.2
Labs .................................................................................................................. 78
A.5.3
Rigs .................................................................................................................. 79
A.5.4
Materials ............................................................................................................ 82
A.5.5
Test series ......................................................................................................... 84
APPENDIX B
- MAIL LIST OF ICET CONTRIBUTORS AND TEST PANEL MEMBERS ......... 89
PART II
EXPERIMENTAL DATA
ABOUT THIS VOLUME ................................................................................................ iii
VIBRATORY RIGS VR
1
CISE, Milan, Italy (vibrating specimen) ............................................................... 003
2
CSSRC, Wuxi, China (vibrating specimen) ......................................................... 027
3
Hiroshima University, Hiroshima, Japan (vibrating specimen) ........................... 051
4
Hiroshima University, Hiroshima, Japan (stationary specimen) ......................... 077
5
IMP PAN, Gdańsk, Poland (vibrating specimen) ................................................ 105
6
Technical University of Ostrava, Ostrava, Czech Republic (vibrating specimen) 133
7
Technical University of Ostrava, Ostrava, Czech Republic (stationary specimen) 153
8
Tsinghua University, Beijing, China (vibrating specimen) .................................. 161
9
University of Cape Town,
Rondebosch, South Africa (stationary
specimen) ..... 207
10
University of Hull, Hull, United Kingdom (stationary specimen) ....................... 245
11
Institute of Water Problems,
BASci., Sofia, Bulgaria (vibrating specimen) ….. 283
12
Institute of Water Problems,
BASci., Sofia, Bulgaria (stationary specimen) …. 307
ROTATING DISKS RD
1
CSSRC, Wuxi, China .......................................................................................... 003
2
IMP
PAN, Gdańsk, Poland .................................................................................. 019
3
KSB AG, Frankenthal, Germany ......................................................................... 047
4
SIGMA VU, Olomouc, Czech Republic ............................................................... 075
CAVITATION TUNNELS[1] CT
1
City University, London, United Kingdom (pin = 0.9 MPa) ................................ 003
2
CSSRC, Wuxi, China (pin = 0.1 MPa) .................................................................. 025
3
Hannover University, Hannover, Germany (pin = 0.6 MPa) ............................... 037
4
Hannover University, Hannover, Germany (pin = 0.7 MPa) ............................... 061
5
Hannover University, Hannover, Germany (pin = 1.0 MPa) ............................... 085
6
Hiroshima University, Hiroshima, Japan (pin = 0.4 MPa) .................................... 109
7
VK-AK Peitz, Hohenwarte, Germany (pin = 0.8 MPa) .......................................... 137
8
Institute of Water Problems, BASci., Sofia, Bulgaria
(pin
= 1.36 MPa) ……… 165
CAVITATING JET CELLS1 CJ
1
FCRI, Palghat, India (9.8/0.14
MPa) ..................................................................... 001
2
Hannover University, Hannover, Germany (14.0/0.1
MPa) ...….......................... 043
3
Hannover University, Hannover, Germany (17.0/0.1
MPa) ................................. 067
4
Hannover University, Hannover, Germany (19.0/0.1
MPa) ................................. 091
LIQUID JET FACILITY LJ
1
SIGMA VU, Olomouc, Czech Republic ............................................................... 001
ABOUT THIS
VOLUME
The present volume is the second part of the International Cavitation
Erosion Test (ICET) Preliminary
Report. Experimental data presented in both volumes and the attached ICET
database are the result of joint effort of 15 laboratories taking part in the project. The aims and scope of ICET as
well as preliminary analysis of results are presented in Part I of the Report
[1]. It is to be stressed that each Participant took care by himself to provide
for financial support of his contribution to the project. No such support was
available from the side of the Test Co-ordinator. Wide response to the
initiative can be therefore considered a measure of significance attributed by
eminent research and development centres to the goals of the project.
The data obtained were carefully reviewed and processed in order to be
presented in a standardised form in this volume. The documentation of each test series (a series of tests conducted
on the set of materials under specified test conditions at the specified
facility) consists of :
·
a copy of the Test Rig Identification Card
which can be supplemented by additional
schematics, drawings or photographs,
·
Laboratory Results Summarisation Card which
includes
-
values of parameters defining test conditions
at the specified rig[2],
-
Test Series Summarisation Table,
-
averaged curves of cumulative volume loss and mean depth of penetration
determined for all the materials tested in the series,
·
documentation of all the tests[3] conducted in
the series
The
Test Series Summarisation Table comprises the following data:
·
commercial name of each material tested,
·
test duration,
·
volume loss,
·
eroded area,
·
mean and maximum depth of erosion penetration,
·
incubation periods,
·
maximum and ultimate values of mean depth of
penetration rates.
All the single-number parameters listed in the Test Series Summarisation
Tables are averaged values. In case of different test duration for different
materials, meantime values are added in order to compare erosion progress
corresponding to the same exposure. Eroded area was usually specified by the
contributor although in some cases it was needed to read it out of photographs.
Mean depth of erosion penetration for each run was calculated by dividing the
volume loss by the eroded area. Incubation periods t0.2 and tinc are defined by an 0.2 mg mass loss and the tangent to cumulative volume
loss curve at the inflection point, respectively.
Documentation of each test consists of:
·
values of parameters defining test conditions,
·
Test Summarisation Table,
·
additional comments on test and data processing
technique applied,
·
list of enclosures,
·
cumulative volume loss curves for each
specimen,
·
averaged mean depth of penetration curve,
·
averaged mean depth of penetration rate curve,
·
optional data (enclosures)[4]which
can include:
-
microhardness distribution table (if
available),
-
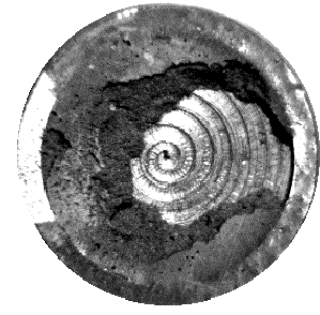
photograph(s) of eroded surface(s)
(including those obtained by means of optical and/or scanning electron
microscopy),
-
maximum depth of penetration curve,
-
metallographs (obtained by means of optical
and/or scanning electron microscopy),
-
roughness profiles of eroded surfaces.
The Test Summarisation Table comprises all the erosion parameters listed
already in the Test Series Summarisation Table. However, data for each specimen
are given. The averaged values are shown below the Table.
The main part of the data processing work was conducted between 1989 and
1991. Due to scarce access to the professional software, all the curves were drawn
manually. Averaging was conducted very carefully in order to provide for smooth
shape of both the cumulative erosion and erosion rate curves, which were also,
determined using traditional techniques. Merits and demerits of such a
procedure can be a matter of discussion.
In
order to allow easy access to most of the source data delivered by the ICET
Contributors a database software has been developed. Installation files of the
database are attached to this Report. Further details including user’s guide are
to be found in Part I of this Report.
Dr Janusz Steller
ICET Co-ordinator
Gdańsk, September 1998
REFERENCES
1. Steller J.: International
Cavitation Erosion Test. Preliminary Report.
Part I: Co-ordinator’s Report. IMP PAN Rep. 19/98